Workshop Title:
Data Visualization Methods in Healthcare
Date:
September 12th, 2024 (BST)
Organizer:
University of Portsmouth
Keywords:
- data
- visualization
- healthcare
- AI
- data analytics
Workshop Chair:
Personal Bio:
Dr. Elisavet Andrikopoulou is a Senior Lecturer at the School of Computing, University of Portsmouth, United Kingdom (UK). Elisavet holds a PhD in health informatics. She has won several awards including the HDR UK Collaborathon 2020. Elisavet has a computer science and law background as well as a master's degree in research in simulation modelling. Elisavet has worked in Greece, Germany, Belgium and the UK in a number of positions varying from law apprentice to database administrator and IT consultant. Her current research interests involve healthcare decision making support and improving the quality of life of people with long-term conditions using technology specialising on personal health records. Elisavet is the events and communications lead of healthcare executive group of BCS and a member of IET, and her teaching focuses mainly on data visualisation and data analytics.
Workshop Description:
Background:
A 2018 healthcare consultancy report calls for the use of "smart healthcare" involving use of technology to treat and diagnose illness, and use of patient data effectively. The "Data saves lives" policy published by the Department of Health and Social Care in England, also envisions interoperable healthcare systems with data at their core. Global health organizations such as WHO promote visualization of clinical data for exploration, analysis and dissemination. The aim of the data visualization in healthcare could be explanation, exploration or exhibit. We can explore some quantitative and qualitative data in health, we can exhibit some facts and we are able to explain instances of incidents based on data. When working with data we go through some steps: (1) data gathering; (2) data familiarization via examining them; (3) data modification and transformation (4) data exploration and analysis. We then can fit our understanding in one of the four categories: The things that we know; things that we are sure we do not know; things we are unaware of not knowing and the things we are unaware of not knowing. Uncertainty, complexity and qualitative data are prominent in healthcare.
A person has about 5 seconds to look at a visualization before deciding whether it interests them or not, and depending on the type of visualization and the person consuming it, several messages can be understood or lost. Healthcare and digital literacy also play a role in the choice of data visualization for patients as well as clinicians. Does the public, clinicians, patients and their families understand the data the same way? This conversation will be around methods and frameworks that we can apply to enhance healthcare visualizations to improve understanding.
Goal/Rationale:
Clinical data are visualized using a variety of methods. We argue that they can be used to create informative, interactive and memorable visualizations, based on the type of the audience and their health and digital literacy. To successfully complete these we need to educate developers and clinicians and to create a clear step by step process model. The model should include the results from the comparison between the data visualization methods, a blueprint or guideline on how we can visualize clearly clinical data for the different stakeholders, patients, clinicians and policy makers and whether Python, R or any other programming language or software such as Tableau and Power BI would be used to translate and merge those key differences.
Scope and Information for Participants:
We suggest that the key to enhance healthcare visualizations to improve understanding is to clearly identify the differences between the target audiences and what works for whom in what circumstances. A better healthcare data visualization framework will lead to more comprehensive and usable visualizations. This could progressively lead to an easier development of data visualization tools, reducing consultation times, reducing costs and greater opportunities for health informatics training. The intended outcome of the workshop is an action plan to develop a model on methods and frameworks that we can identify, augment and apply to enhance healthcare visualizations to improve understanding and patient-clinician communication.
Highlights
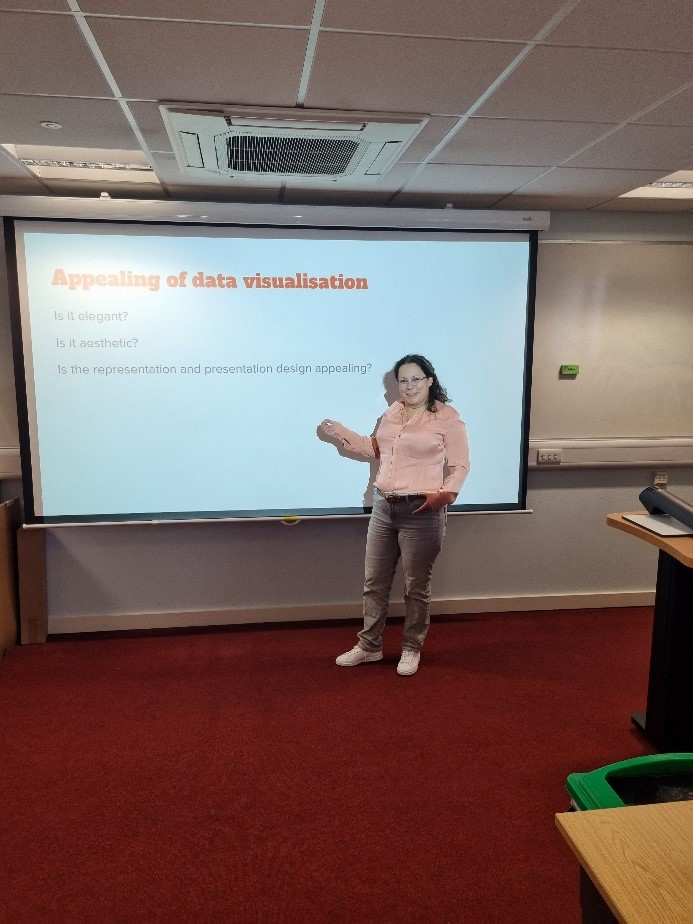
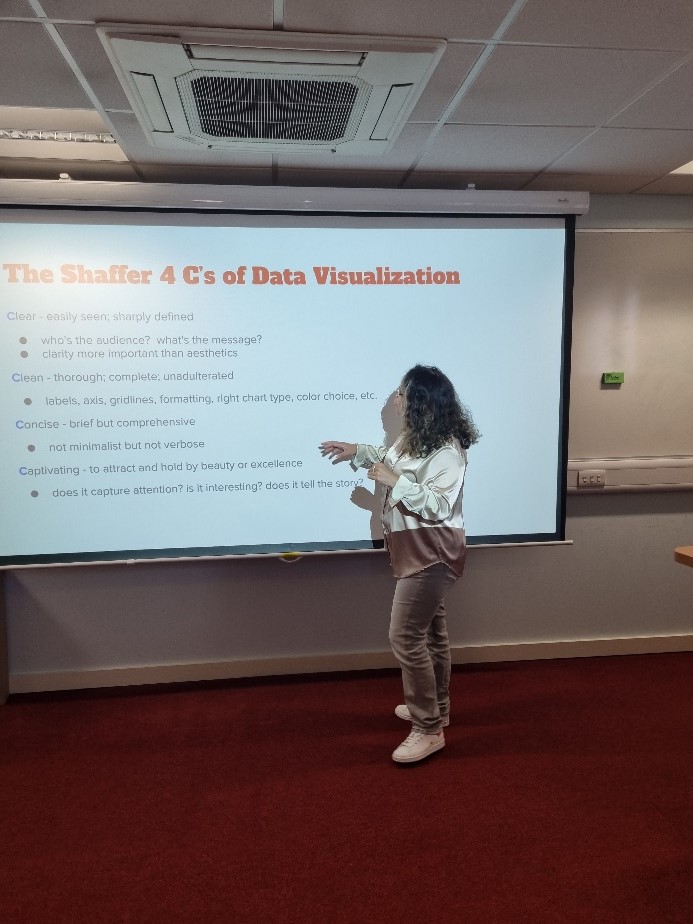
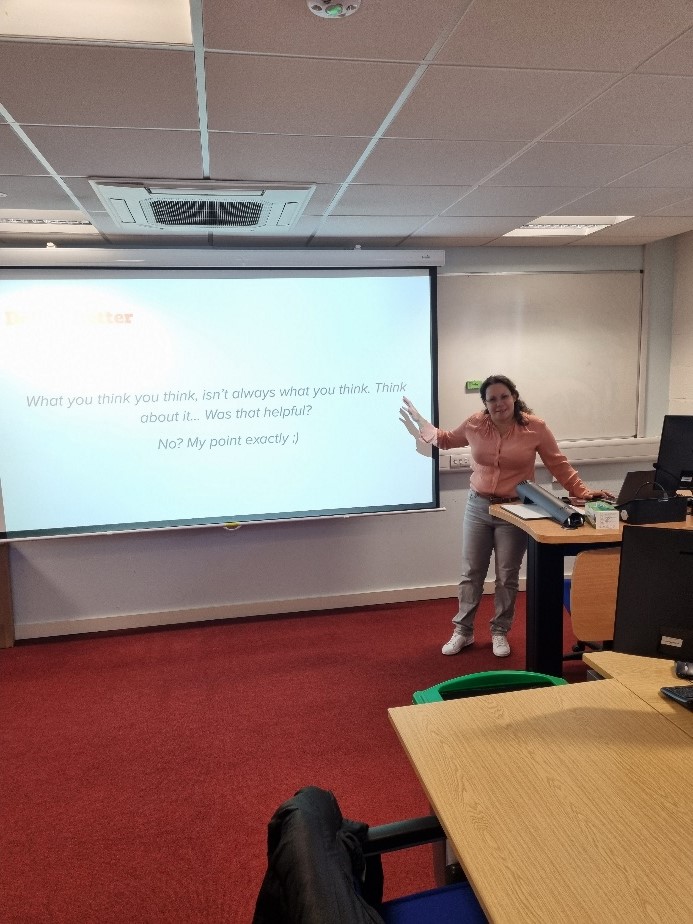
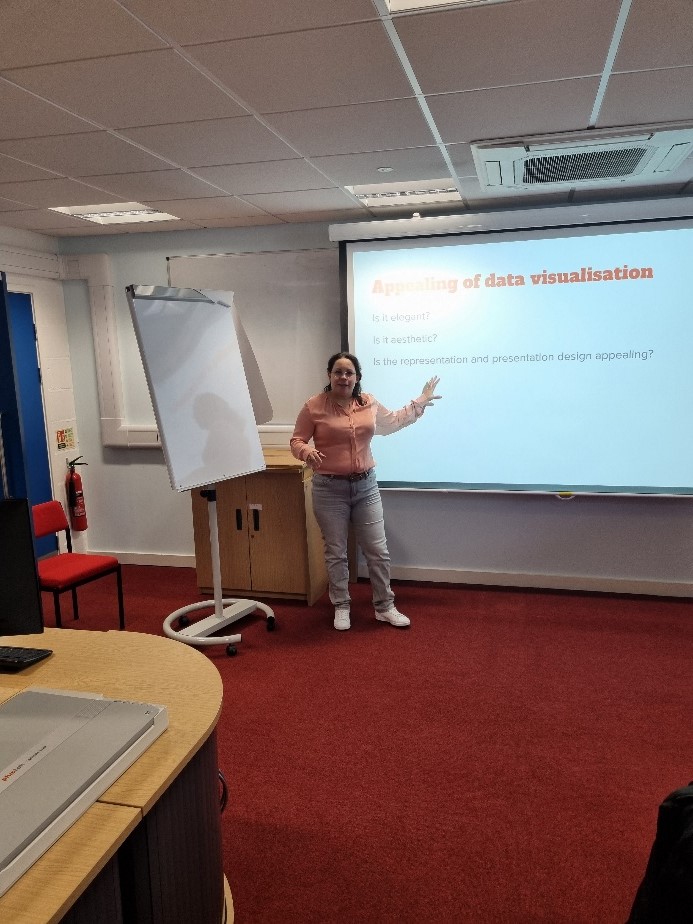
The workshop “data visualisation methods in healthcare” was successfully held on September 12th 2024 by Dr Elisavet Andrikopoulou. The 12 students attended the workshop were master and doctoral students of the University of Portsmouth, UK. The workshop explored various chart types which was both enjoyable and enlightening. It helped reveal the strengths and weaknesses of each visualization method, allowing the students to select the one that best convey their story. For example, to determine which players, games, or countries were the most successful in the Olympics, a bar chart proves to be a simple yet effective choice for making comparisons.
One of the most frequent questions we receive is: “What’s the right visualization for my data?” Choosing the appropriate visualization can be overwhelming, but it becomes easier once you understand the key principles. To illustrate this, I created ten different visualizations using a single dataset—the SOPCA dataset, which focuses on Olympic performance data sourced from kaggle.com.


Access to Workshop:CONF-CDS 2025 Workshop -- Portsmouth - YouTube
Venue:
DS 2.01, University of Portsmouth, Portsmouth, UK

VISA:
Welcome to GOV.UK
In order to ensure the information is correct and up to date, there may be changes which we are not aware of. And different countries have different rules for the visa application. It is always a good idea to check the latest regulations in your country. This page just gives some general information of the visa application.
UK Visa Information
What you need to do
- Check if what you plan to do in the UK is allowed as a Standard Visitor.
- Check you meet the eligibility requirements.
- Check if you need to apply for a visa to visit the UK.
- Apply for a Standard Visitor visa online - if you need one.
Check you meet the eligibility requirements
You must have a passport or travel document to enter the UK. It
should be valid for the whole
of your stay.
You must be able to show that:
- you'll leave the UK at the end of your visit
- you're able to support yourself and your dependants during your trip (or have funding from someone else to support you)
- you're able to pay for your return or onward journey (or have funding from someone else to pay for the journey)
- you'll not live in the UK for extended periods through frequent or successive visits, or make the UK your main home
Check if you need a visa to visit the UK
Depending on your nationality, you'll either:
- have to apply for a Standard Visitor visa before you travel to the UK
- be able to visit the UK for up to 6 months without needing a visa
You can check if you need a visa before you apply.
If you do not need a visa, you must still meet the Standard Visitor eligibility requirements
to visit the UK. You may be asked questions at the UK border about your eligibility and the
activities you plan to do.
Attend in person:
If you want to attend the workshop on-site, please email the Conference Committee: info@confcds.org.


